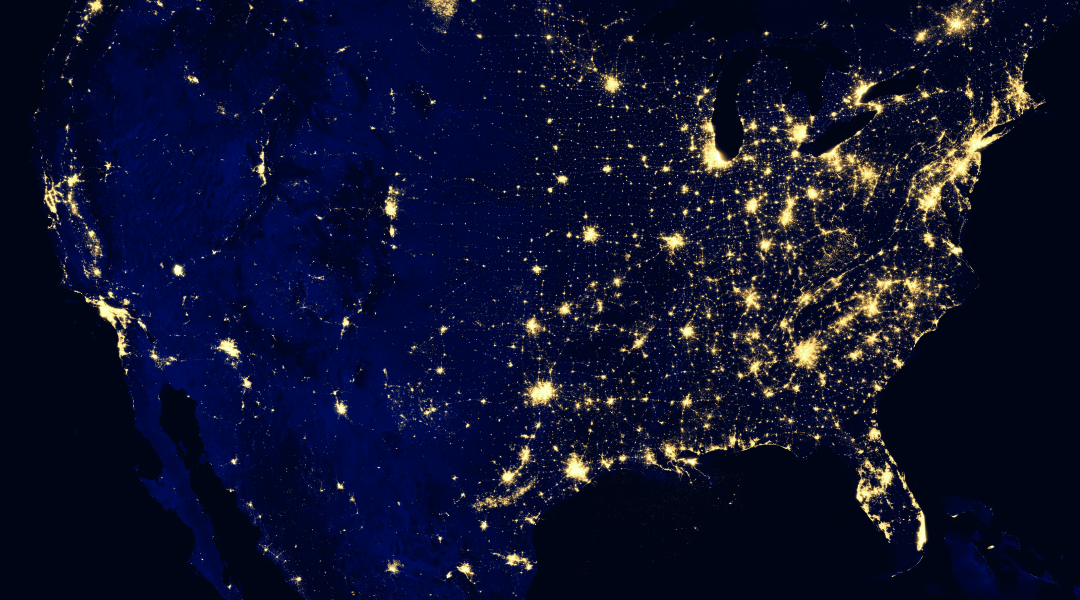
The hunt for timely and accessible data can be an endless story for scientists relying on geographic information to reveal new knowledge about human and environmental processes. Earth Observation, which is the gathering of information about the physical, chemical, and biological systems through remote sensing, is today a highly vibrant field, as new datasets are continuously being released and developed. These large-scale datasets span from being remotely sensed images, to being measured on the ground and given in point format. In between, a wide number of datasets are being released, building on and combining with other datasets.
In a recent study published in WIREs Water, researchers from the Swedish Uppsala University and KTH Royal Institute of Technology have created and structured a collection of freely accessible global datasets to support future studies on floods, droughts, and their interactions with changing societies.
PhD candidate Sara Lindersson says that the aim is to provide a systematic collection of datasets, mainly targeting readers from the domain of water-related disaster research. “But we also think that the review can interest a wider audience. Our collection of datasets covers a broad spectrum of environmental and socioeconomic variables spanning from river discharge measurements to population density maps, since the very core of disaster research is interdisciplinary. Global datasets can also be valuable for local studies, especially when located in data-poor regions.”
Professor Giuliano Di Baldassarre, one of the study’s authors, states that “these new datasets offer unprecedented opportunities for the study of floods and droughts in a rapidly changing world.”
There are, however, numerous challenges when using these large-scale datasets in scientific studies. One challenge relates to the fact that global datasets consequently tend to only capture large objects. According to Lindersson: “This can easily generate a mismatch in scales, for example, if you are attempting to use a global flood hazard map in an urban-scale study and the river flowing through the city is too small to even be included in the global map. The study of smaller disaster events is also affected by this data gap. For instance, a local flood event can end up being missed by both the remotely sensed flood maps and the disaster loss databases, which only consider severe events that fulfil specific disaster loss thresholds, such as at least 100 affected people per event. This is ironic since it is typically the data-poor regions that suffer the most from local, low-severity but frequent, disaster events.”
The review of datasets confirms that we are currently more skilled at mapping the hazard and exposure components of the risk equation, compared to vulnerability aspects. Lindersson gives the example of flood risk analysis: “We know which areas are under risk of being flooded, where we have buildings, and how these components have evolved over time. We are less skilled, however, at mapping factors that can affect the capacity to withstand a disaster, such as level of income. But I am quite optimistic that we will soon see further progress in capturing vulnerability aspects as well, not least due to very high-resolution satellite imagery in combination with machine learning techniques.”
Written by: Sara Lindersson
Reference: S. Lindersson, et al. ‘A review of freely accessible global datasets for the study of floods, droughts and their interactions with human societies‘, WIREs Water (2020). DOI: 10.1002/wat2.1424


