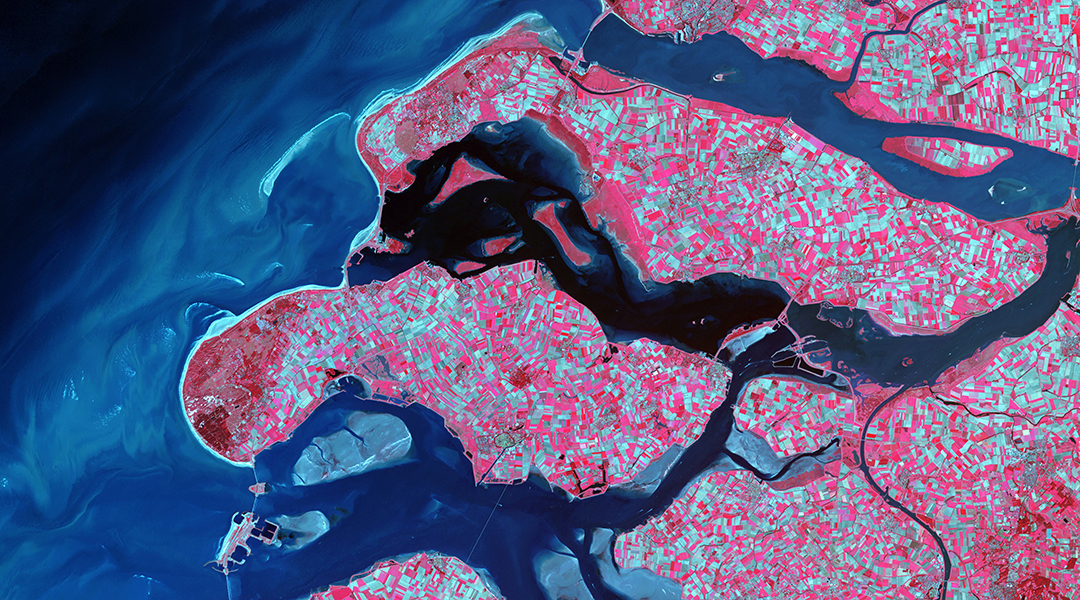
Scientists are establishing a better way to track and monitor greenhouse gas emission sources round-the-clock using satellite imagery.
“Power plants, megacities, and other regions can be places where considerable amounts of gases are emitted into the atmosphere,” wrote scientists at Empa in a recent study. “Satellite data is capable of recording the enhanced concentrations in the atmosphere [but how] does one estimate emissions of these sources based on this data?”
It’s well-established that human-made emissions of greenhouse gases, such as carbon dioxide (CO2) and methane, are causing our climate to change. Despite knowing this, emissions keep increasing year after year — although at a smaller rate compared to the recent past.
CO2 concentrations in particular are currently at record highs compared to historical levels. Despite the significant impact of CO2 and other greenhouse gases on climate change, they are present in minute quantities in the atmosphere, typically measured in parts per million (ppm).
This makes precise quantification of greenhouse gas emissions challenging, as these gases are highly diluted compared to the major components of the atmosphere.
To address this challenge, a new study is exploring advanced satellite technology to improve the detection, tracking, and quantification of sources emitting carbon into the atmosphere. This innovative approach aims to enhance our understanding and measurement capabilities of greenhouse gas emissions on a global scale.
Help from above
Satellite technologies are ubiquitous nowadays, with networks covering the Earth’s entire surface to track and monitor emissions sources. However, knowing about a carbon-emitting source is not enough as gas molecules do not remain in the same spot for long. This is an example of an inverse problem, which involves working backwards from the effects to infer the causes.
“Turning trace gas concentration satellite observations into quantified source contributions is a hard inverse problem,” wrote the scientists. “The relation between the source emissions on the one hand, and the satellite observations on the other, depends on atmospheric transport.”
Scientists have developed numerous models to try and quantify these emissions by simulating how gases propagate through the atmosphere, mainly driven by local wind patterns. But these models are expensive to run and need a very high resolution to resolve the individual emission plumes. Perhaps the biggest sticking point is the fact that a number of assumptions must also be made in order to simplify the problem.
“When applying a theory in the real world, you sometimes must make simplifying assumptions to make a problem tractable. This is fine, as long as you clearly understand, quantify, and report the effect that these assumptions may have on your results,” explained Clay Roberts, atmospheric climate scientist at the Netherlands Institute for Space Research, who was not involved in the study.
While these models provide useful information, they are not always completely accurate or provide conclusive information as a result. These might center around the way gases propagate through the atmosphere, or do not take into account the fact that images might contain missing pixels.
“Satellite observations of methane, for example, often have sparse spatial coverage due to interference from clouds,” explained Roberts.
This is what the Empa team hoped to solve. They developed a better way to track and quantify emissions by individually testing each assumption their model would need to make, providing a better basis to solve the problem of tracking with greater accuracy.
For instance, the researchers used two methods to find carbon-emitting sources. One method, called the “divergence” approach, combines satellite images with wind patterns to detect these sources. The other method, known as the “cross-sectional flux” method, starts by locating a source and then calculates how much carbon it emits.
These methods might seem alike, but they focus on different factors like the size of the emission plume and the clarity of the images. To get precise results, scientists choose the method that best fits each situation, aiming to minimize errors and ensure accurate measurements of emissions.
Who watches the watchmen?
Satellites are indispensable tools for tracking emissions of greenhouse gases and dangerous pollutants, and studies like this will provide scientists with a better framework to translate images into accurate numbers.
While a promising step forward, there are still many factors at play that need further consideration. “The application of the divergence method to satellite observations containing ‘missing data’ is a problem not fully addressed,” explained Roberts. These missing pixels are a deal because they can confuse emissions computations, which work best with clear images.
Another issue, though its severity is debatable, is considering the influence of topography, such as the presence of mountains or valleys, of the area close to the emitting source. The study’s authors ruled these out these as unimportant. However, according to Kung Sun, assistant professor at the University of Buffalo, who was also not involved in the study, “[The authors of the study themselves] admitted in practice that topography poses a strong interference to the estimated emission.”
All this warrant further development to improve the accuracy of satellite emission tracking, but the team’s framework has taken significant strides. Hopefully more research will build off of studies like this one, paving the way to reliable estimates of greenhouse gas emissions, on which the future of humanity crucially depends.
Reference: E. F. M. Koene, D. Brunner, G. Kuhlmann, On the Theory of the Divergence Method for Quantifying Source Emissions From Satellite Observations, JGR Atmospheres (2024). DOI: 10.1029/2023JD039904
Feature image credit: USGS on Unsplash


