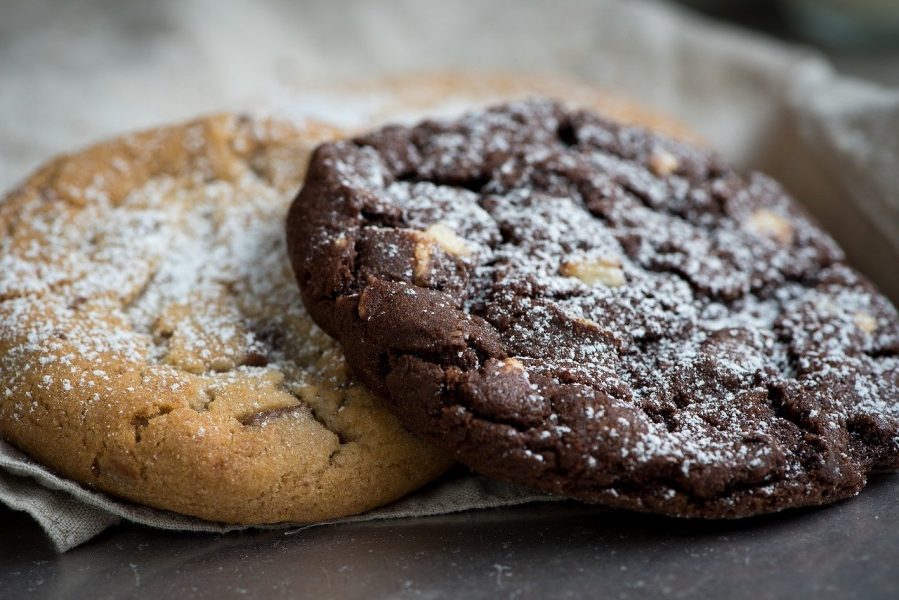
While searching the internet for new cookie recipes, we came across an article explaining how many cookies need to be baked and how many tasters are needed to determine the value of a new cookie recipe. The article was written to teach young students how to form a hypothesis, design an experiment, and analyze that data using statistics (our second obsession after cookies).
Understanding statistics allows researchers from all fields to choose the right way to collect data, interpret them, make conclusions and present their results. But statistics are notoriously poorly applied, rendering the design and analysis of many experiments weak or unreliable. So what better way of explaining how to apply statistics than using baking as an example!
Inspired by the above article, here is a short summary of our suggested “cookie policy”:
To pick your favorite type of cookie, try all kinds of cookies on independent days. Before you make your decision, make sure you eat enough of the same kind of cookie, considering the variation inherent in the nature of baking. (For increased confidence in your data, reproduce the results in independent experiments. Make sure to use a reasonable number of replicates, considering the variation in the nature of the experiment you are conducting.)
Unsure whether you like raisin cookies? To help make your final decision, try them in the same tasting session as the chocolate-chip cookies you know you love and the plain cookies you know you hate. (Include the correct controls, both positive and negative, in your experiments.)
Don’t just mention what types of cookies you ate: when talking about your cookie-eating experience, tell people how many of each type you ate, to be more convincing. (Wherever possible, provide quantitative data along with qualitative data.)
Comparing three or more kinds of cookies requires a different test than when comparing chocolate-chip cookies to plain cookies. Pick the right means of comparison. (Evaluate your experimental setup correctly and use the right statistical test: e.g. don’t use t test instead of analysis of variance (ANOVA) when you need to compare the means of more than two groups.)
Reproducibility is important! To help others bake cookies as tasty as yours, report all the ingredients correctly and record each step in sufficient detail in your recipe. Make sure to standardize your setup – e.g. same baking time for the same kind of cookies. (Report all the details of your experiments and standardize your setup: use the same sex or age of animals for in vivo studies, or cells at the same passage number for in vitro studies. Follow any field-based guidelines that are available for your type of experiment.)
Variations occur between baking rounds. If you end up putting in different amounts of chocolate chips each time you bake, this will affect the taste, so make sure you report exactly how different the amount is. (Include error bars in your data plots. Consider box plots or scatter plots over bar plots, to better illustrate the variance in your samples.)
All statistical tests we are aware of will accept the hypothesis that everyone has a significant need to eat tasty cookies with 99.99999999% confidence. While this author advocates the consumption of cookies in moderation, she also highly recommends that you do try this at home!
Have a look here for a pre-submission checklist of do’s and don’ts to ensure correct data analysis and presentation.
Acknowledgements: Thank you to Lisa Smith for her help in the preparation of this article.
Want more on statistics?
Statistical Challenges in Estimating Past Climate Changes
Outlier Detection Between Statistical Reasoning And Data Mining Algorithms
Essay on Statistical Modeling for Polymerization by Jose Carlos Pinto
Do you study statistics? You can submit your statistics research papers to Advanced Theory and Simulations.


